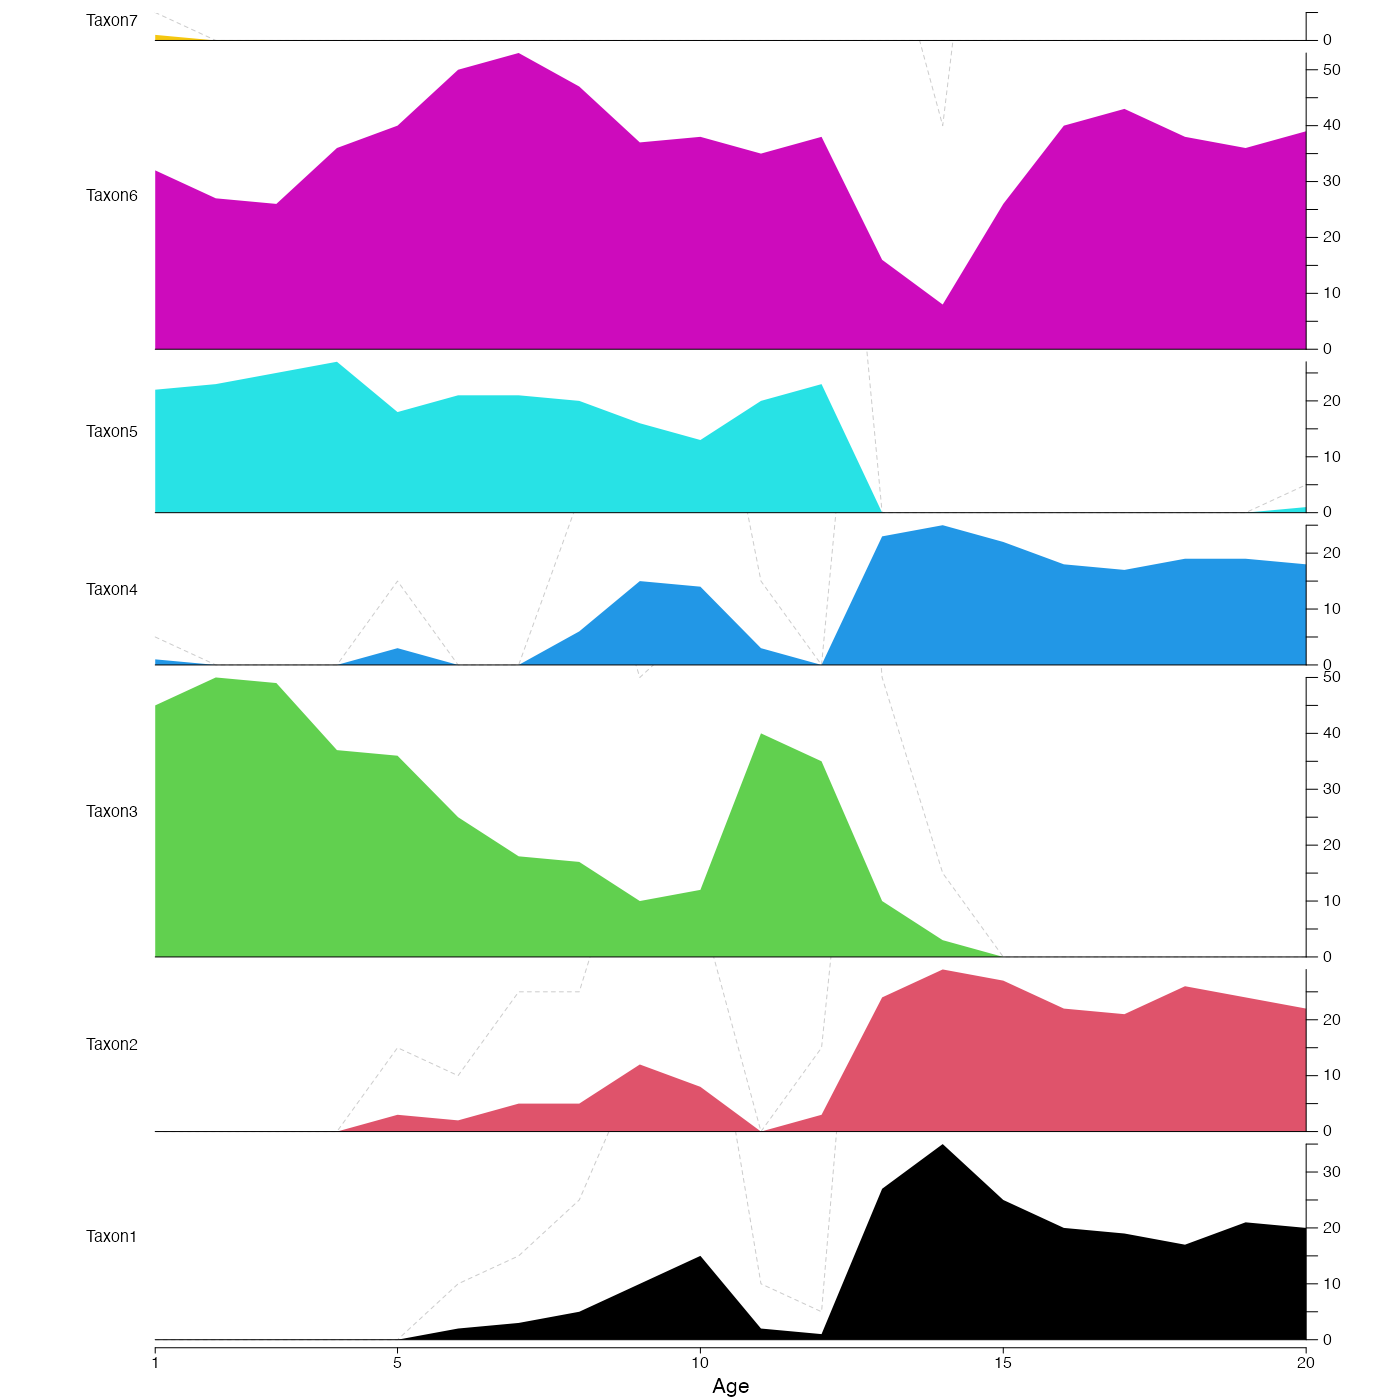
This function plots stratigraphic data either as polygons or bars.
plot_diagram(
  x,
  bars = FALSE,
  col = "black",
  amplif = 5,
  save = FALSE,
  filename = "Diagram.pdf",
  width = 3.54,
  height = 9,
  as.png = FALSE,
  png.res = 300,
  yax_incr = 5,
  bar_width = diff(range(x$inputs$x))/length(x$inputs$x),
  xlim = NA,
  tickAtSample = TRUE,
  col_pos = "black",
  col_neg = "grey80",
  title = NA,
  src = NA
)
Arguments
- x
A data frame of the data to plot (first column with age or depth) and the taxa in the following columns. x can also be a
crestObj.- bars
A boolean that indicates if the data should be plotted as polygons (default:
bars=FALSE) or vertical bars (bars=TRUE).- col
Colours to be used for the polygons. If the number of colours does not match the number of taxa, colors will be recycled.
- amplif
A factor the show exaggeration on the diagram. Only for polygon plot. Default 5.
- save
A boolean to indicate if the diagram should be saved as a pdf file. Default is
FALSE.- filename
An absolute or relative path that indicates where the diagram should be saved. Also used to specify the name of the file. Default: the file is saved in the working directory under the name
'Diagram.pdf'.- width
The width of the output file in inches (default 3.54in ~ 9cm).
- height
The height of the output file in inches (default 9in ~ 23cm).
- as.png
A boolean to indicate if the output should be saved as a png. Default is
FALSEand the figure is saved as a pdf file.- png.res
The resolution of the png file (default 300 pixels per inch).
- yax_incr
Graphical parameters describing the increment size on the y-axis (default 5).
- bar_width
Width of the bars of the barplot (default 1/50th of the x range).
- xlim
The range covered by the x-axis. Can be adjusted to get round numbers on the x-axis. If smaller than the range covered by the data, the data will be truncated (default: range of the data).
- tickAtSample
Boolean that indicates whether a tick mark should be added on the x-axis at the location of each sample (default
TRUE).- col_pos
Graphical parameter for the barplot. Colour of all the positive values (default black).
- col_neg
Graphical parameter for the barplot. Colour of all the negative values (default light grey).
- title
Name to be added on top of the plot (default
NA).- src
A graphical parameter used by the
plot_loo()function.
Value
No return value, this function is used to plot.
Examples
data(crest_ex)
plot_diagram(crest_ex, bars=TRUE, col='black', bar_width=0.8)

plot_diagram(crest_ex,  col=1:7, tickAtSample=FALSE)

#> Replace 'tempdir()' by the location where the sample should be saved (e.g. 'getwd()')
plot_diagram(crest_ex, save=TRUE,
             filename=file.path(tempdir(), 'testDiagram.pdf'),
             bars=TRUE, col_pos='cornflowerblue', col_neg='darkgreen',
             bar_width=0.8, xlim=c(3,15))
#> Replace 'tempdir()' by the location where the sample should be saved (e.g. 'getwd()')
plot_diagram(crest_ex, save=TRUE,
filename=file.path(tempdir(), 'testDiagram.pdf'),
bars=TRUE, col_pos='cornflowerblue', col_neg='darkgreen',
bar_width=0.8, xlim=c(3,15))