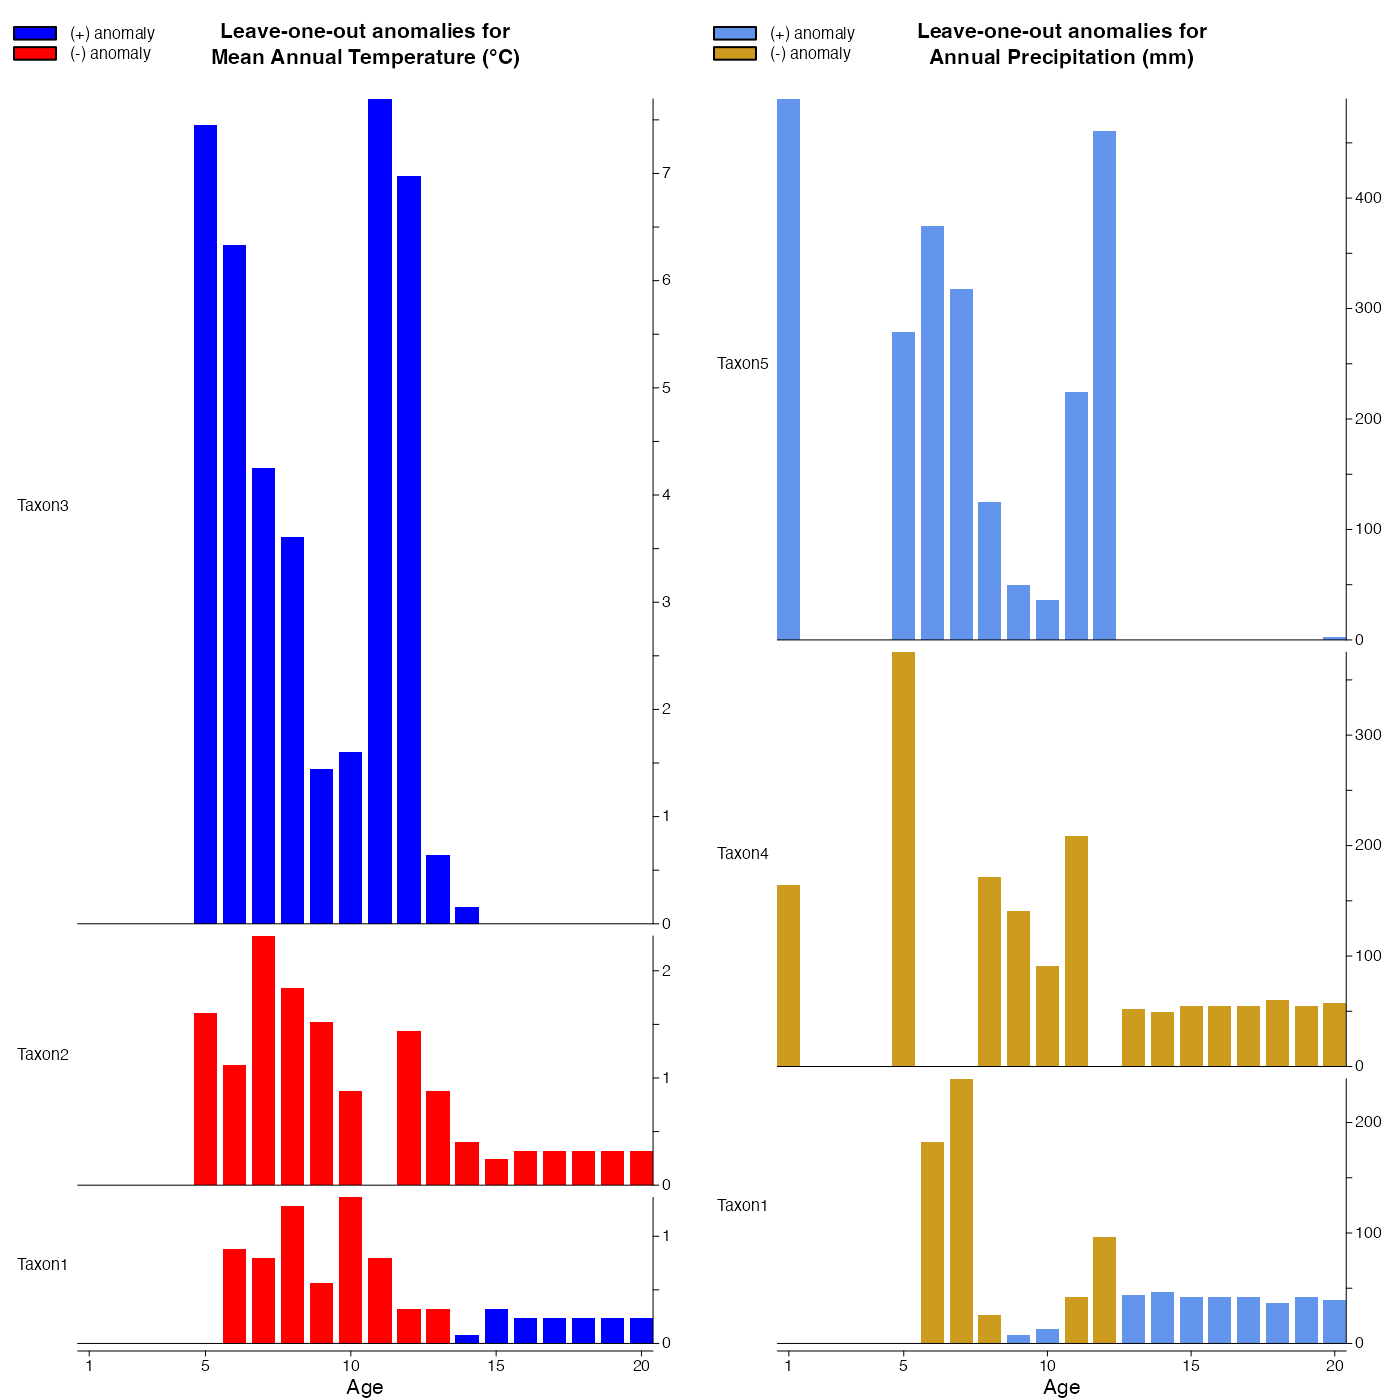
Plot the results of the leave-one-out analysis.
plot_loo(
  x,
  optima = TRUE,
  climate = x$parameters$climate[unlist(lapply(x$reconstructions, function(y)
    return("loo" %in% names(y))))],
  taxanames = x$inputs$taxa.name,
  save = FALSE,
  filename = "Diagram_loo.pdf",
  as.png = FALSE,
  png.res = 300,
  width = 3.54,
  height = 9,
  yax_incr = NA,
  bar_width = diff(range(x$inputs$x))/length(x$inputs$x),
  xlim = NA,
  tickAtSample = FALSE,
  sort = NA,
  filter = 0,
  col_pos = "black",
  col_neg = "grey80",
  title = NA
)
Arguments
- x
A data frame of the data to plot (first column with age or depth) and the taxa in the following columns. x can also be a
crestObj.- optima
A boolean to indicate whether to plot the optimum (
TRUE) or the mean (FALSE) estimates.- climate
Climate variables to be used to generate the plot. By default all the variables are included.
- taxanames
A list of taxa to use for the plot (default is all the recorded taxa).
- save
A boolean to indicate if the diagram should be saved as a pdf file. Default is
FALSE.- filename
An absolute or relative path that indicates where the diagram should be saved. Also used to specify the name of the file. Default: the file is saved in the working directory under the name
'Diagram_loo_climate.pdf'.- as.png
A boolean to indicate if the output should be saved as a png. Default is
FALSEand the figure is saved as a pdf file.- png.res
The resolution of the png file (default 300 pixels per inch).
- width
The width of the output file in inches (default 3.54in ~ 9cm).
- height
The height of the output file in inches (default 9in ~ 23cm).
- yax_incr
Graphical parameters describing the increment size on the y-axis (default 5).
- bar_width
Width of the bars of the barplot (default 1).
- xlim
The range covered by the x-axis. Can be adjusted to get round numbers on the x-axis. If smaller than the range covered by the data, the data will be truncated (default: range of the data).
- tickAtSample
Boolean that indicates whether a tick mark should be added on the x-axis at the location of each sample (default
TRUE).- sort
A string to sort the order of the taxa from the highest to lowest anomalies (sort='incr') or from the lowest to highest (sort='decr'). Use the default value
NAto keep the taxa unsorted.- filter
A threshold value that determines the mean absolute anomaly value required for the taxon to be plotted (default 0 means that all taxa are plotted)
- col_pos
Graphical parameter for the barplot. Colour of all the positive values (default black).
- col_neg
Graphical parameter for the barplot. Colour of all the negative values (default grey80).
- title
Name to be added on top of the plot (default
NA).
Value
When used with a crestObj, it returns the average leave-one-out values for each selected taxa
Examples
if (FALSE) { # \dontrun{
  data(crest_ex)
  data(crest_ex_pse)
  data(crest_ex_selection)
  reconstr <- crest(
    df = crest_ex, pse = crest_ex_pse, taxaType = 0,
    climate = c("bio1", "bio12"), bin_width = c(2, 20),
    shape = c("normal", "lognormal"),
    selectedTaxa = crest_ex_selection, dbname = "crest_example"
  )
  reconstr <- loo(reconstr)
} # }
## example using pre-saved reconstruction obtained with the previous command.
data(reconstr)
loo_vals <- plot_loo(reconstr, yax_incr=c(0.5, 50), bar_width=0.8,
                     col_pos=c('blue','cornflowerblue'),
                     col_neg=c('red', 'goldenrod3'))