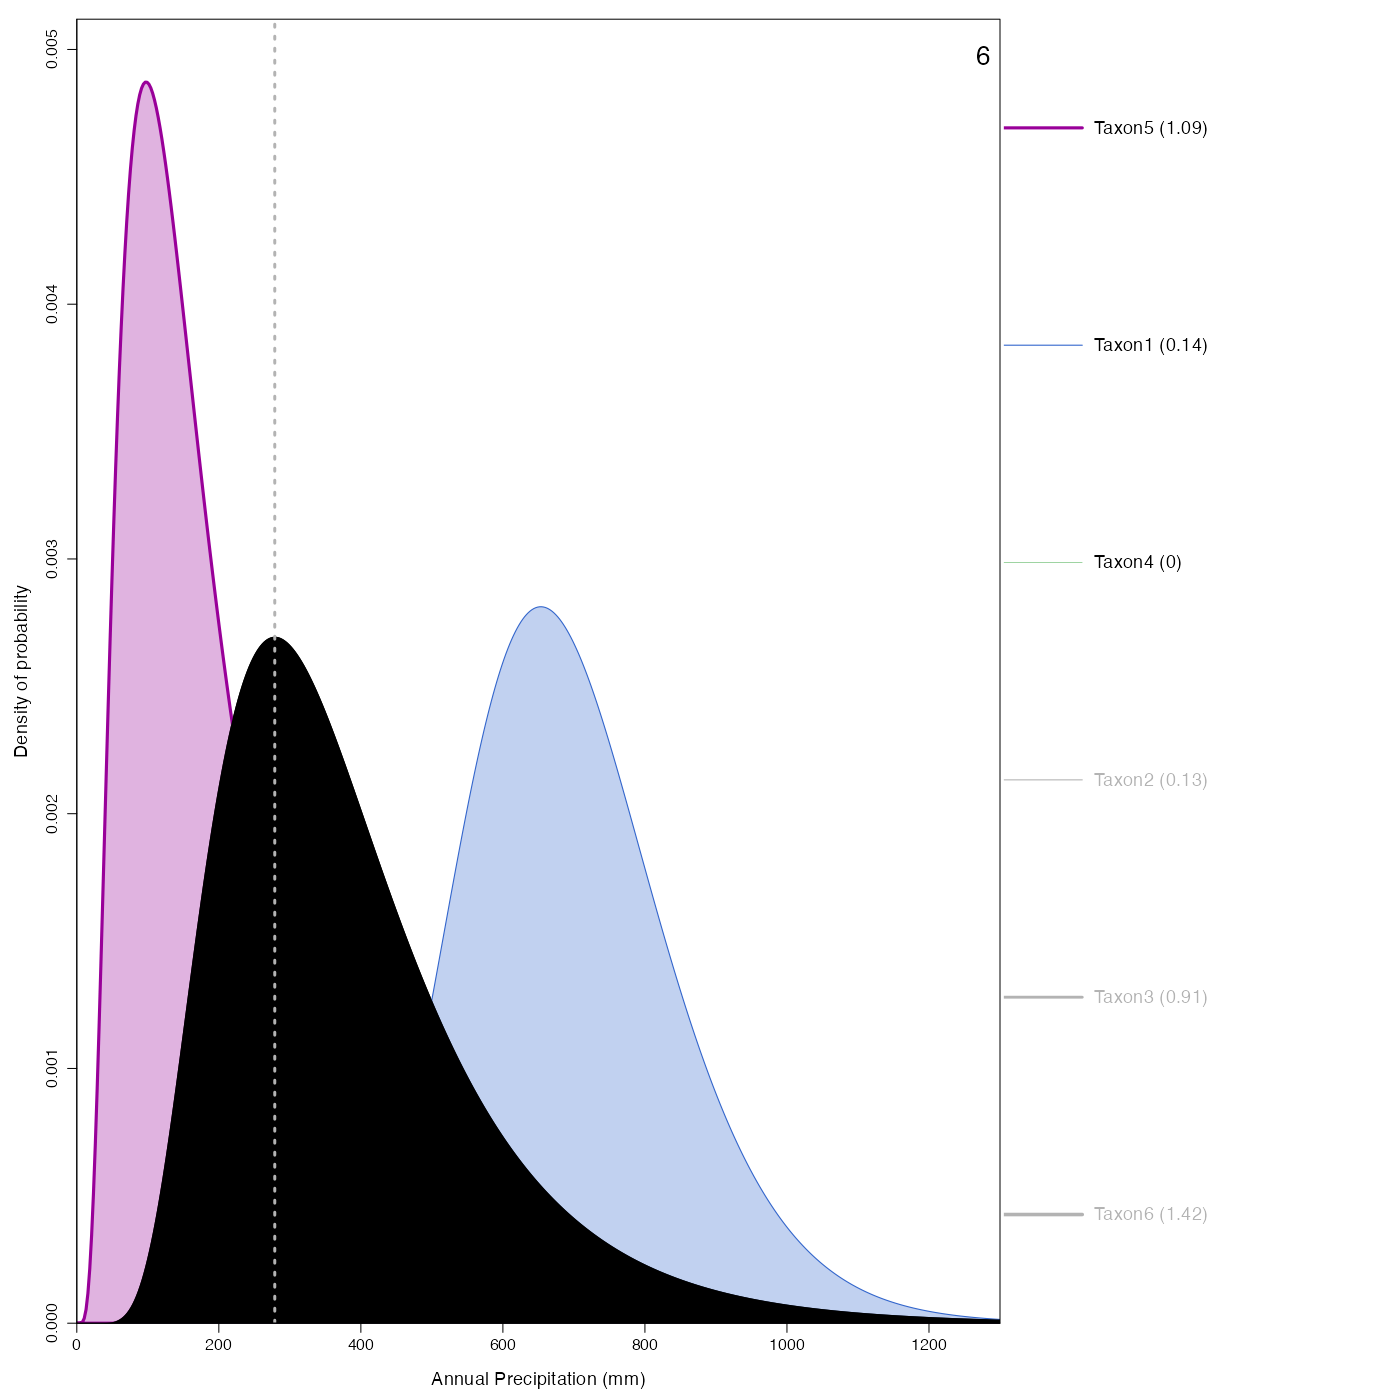
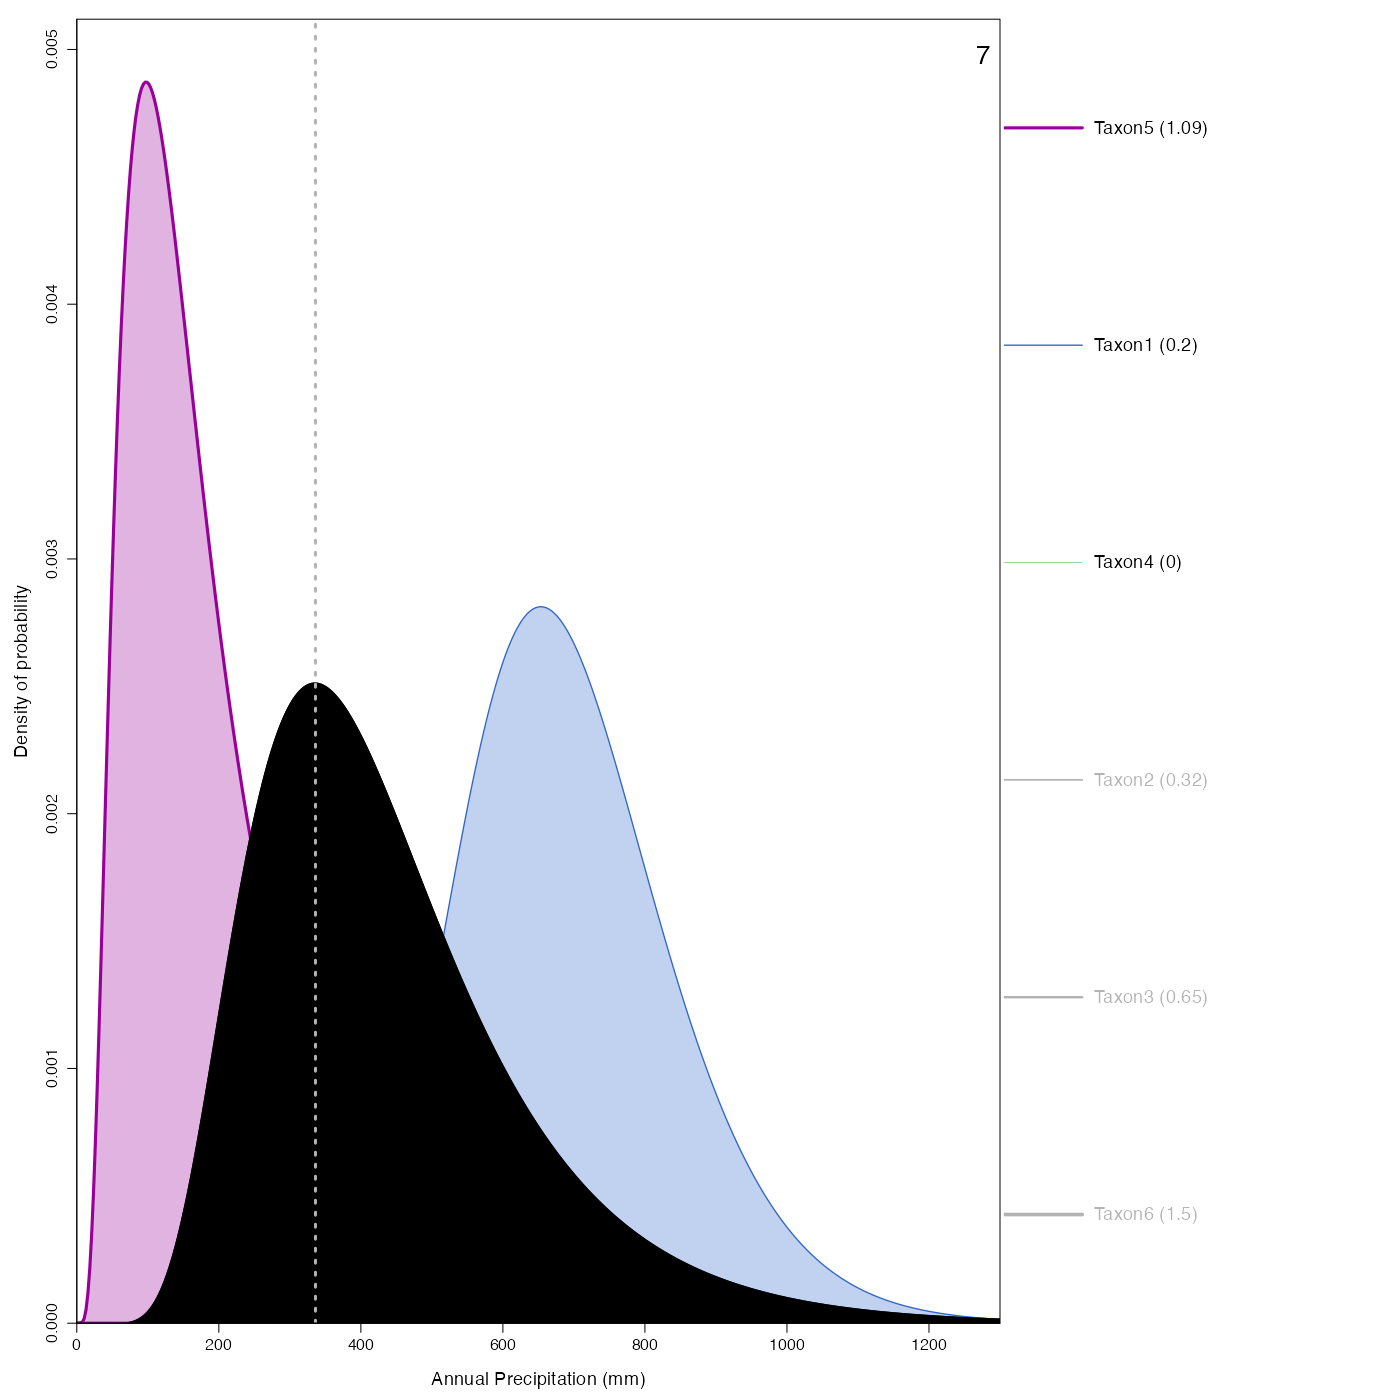
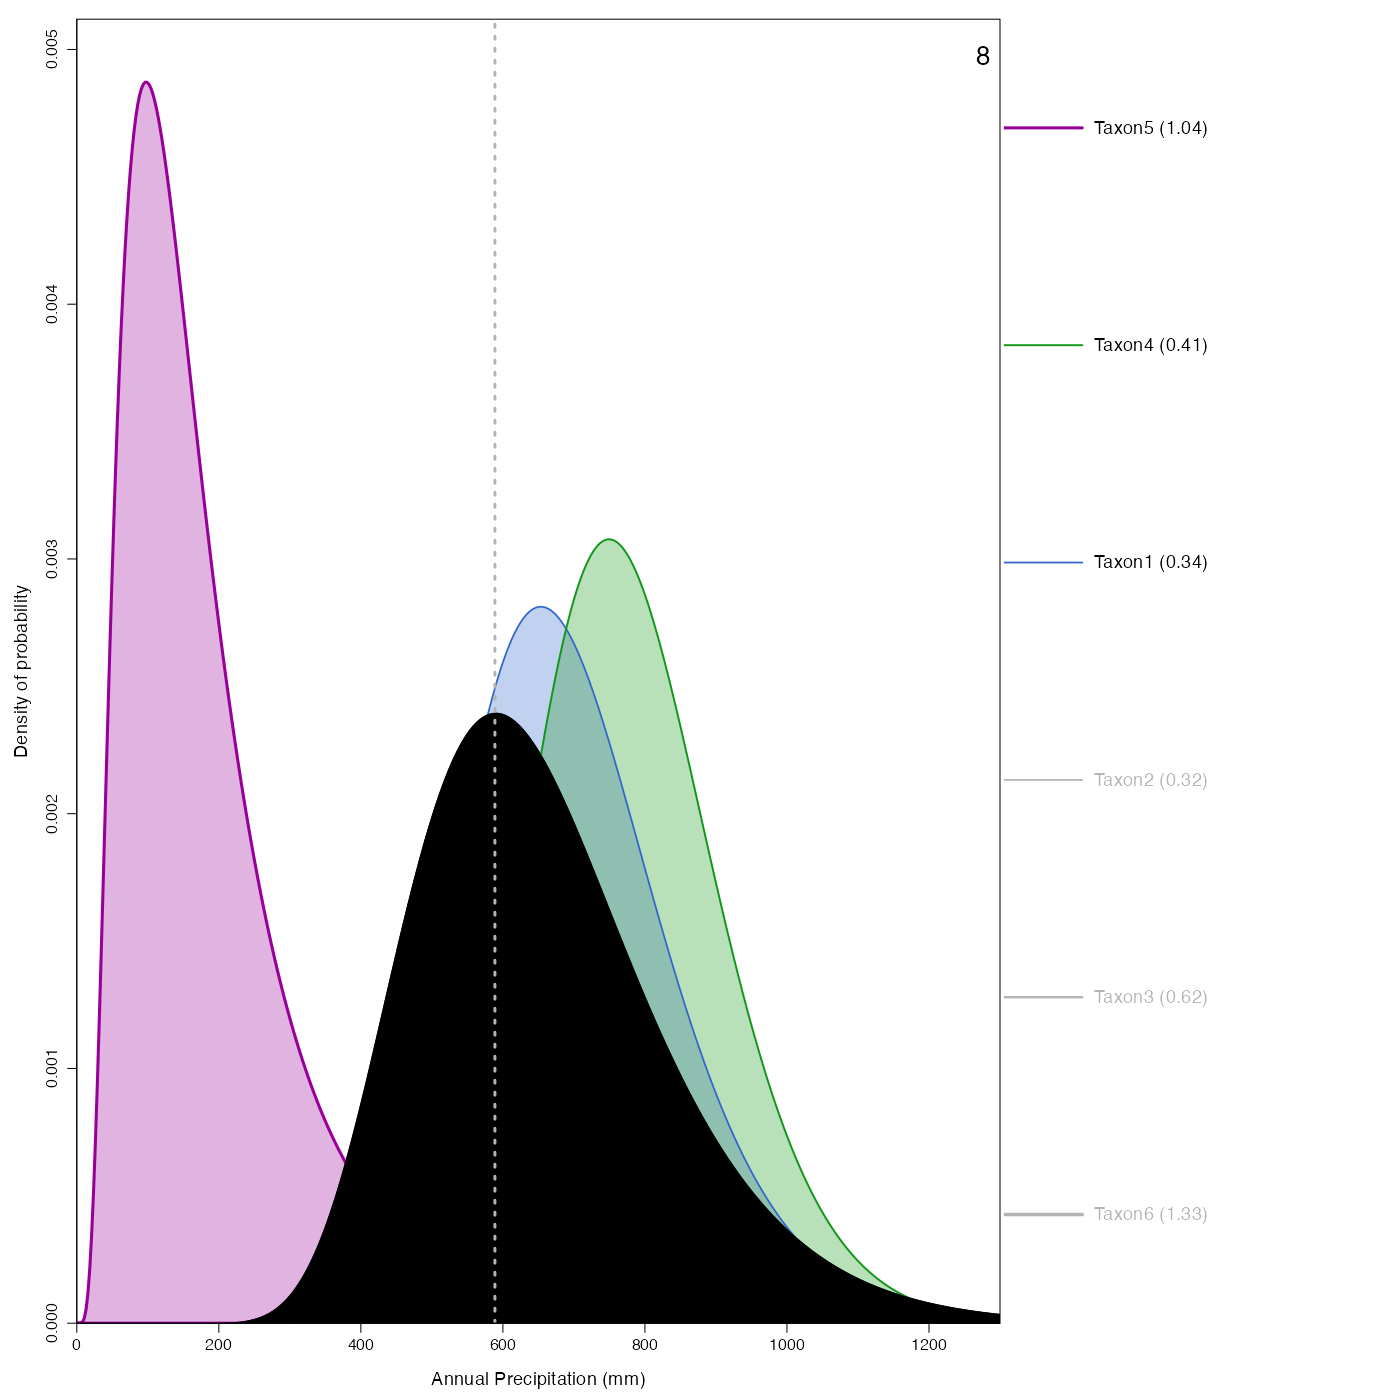
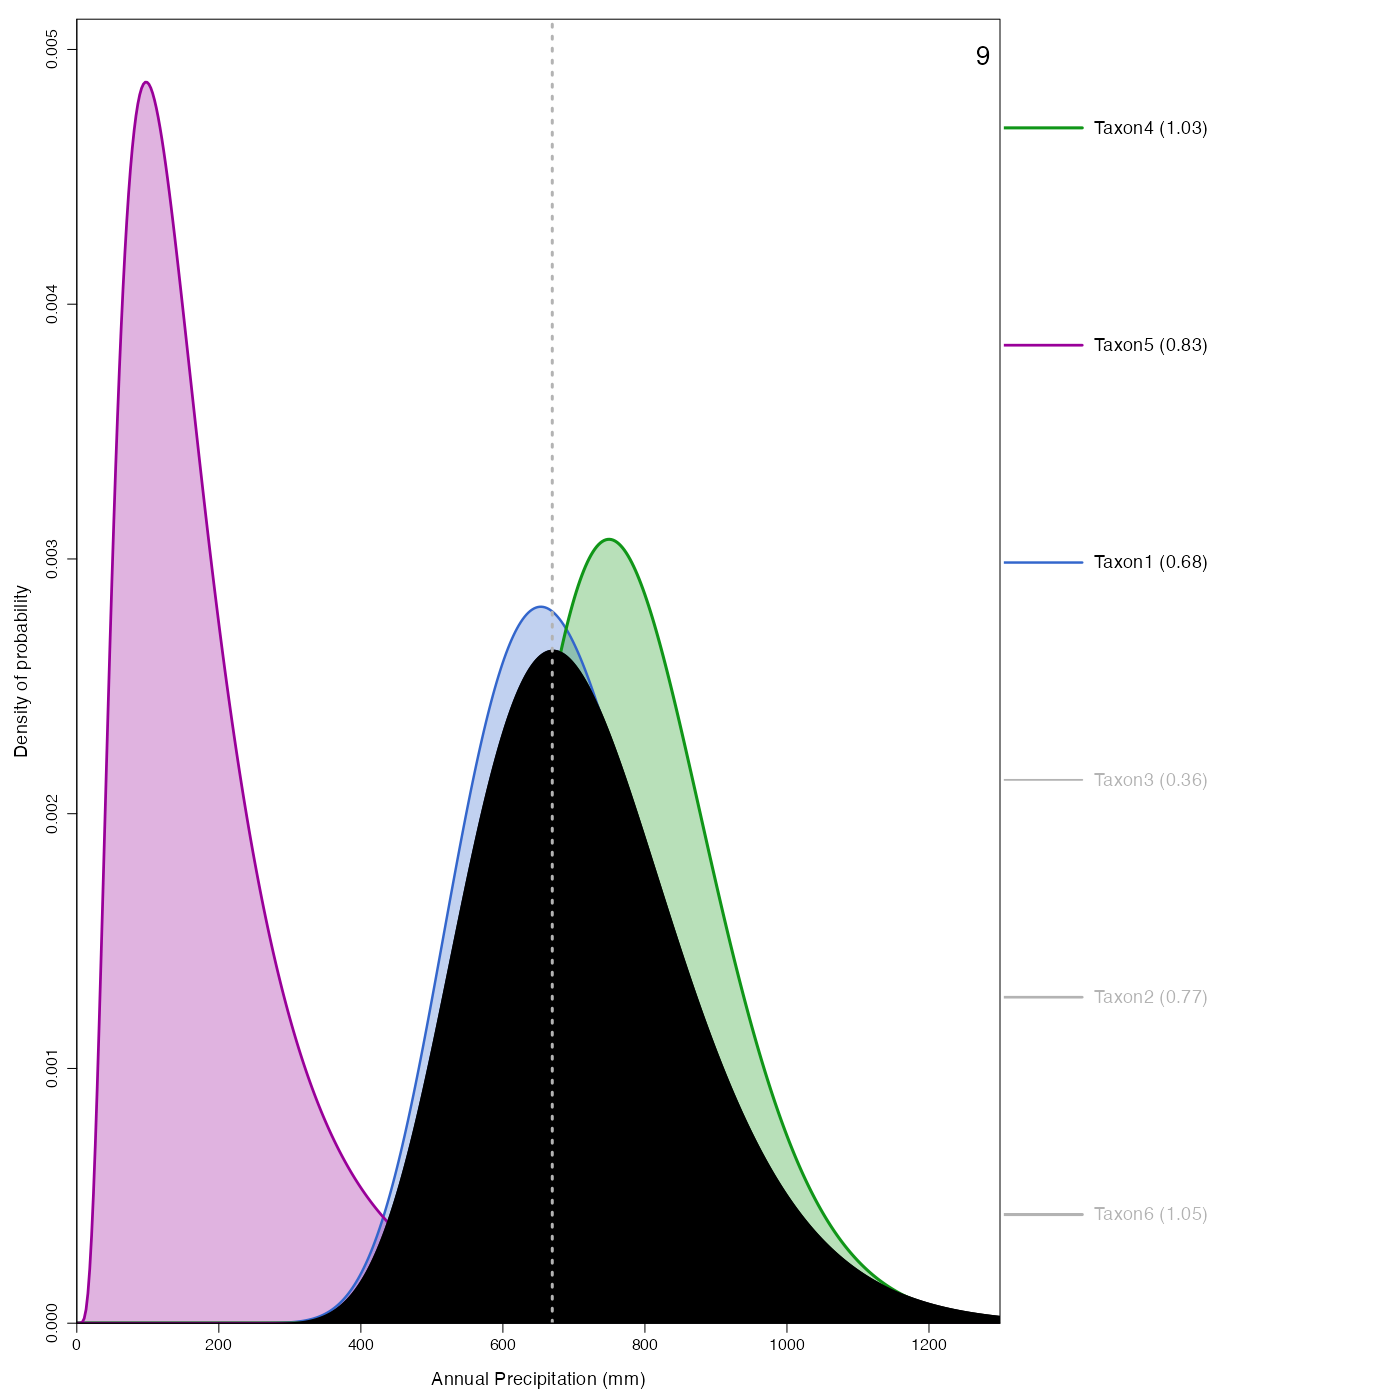
Plot representing how the pdfs combine to produce the reconstruction.
Source: R/plot.combinedPDFS.R
plot_combinedPDFs.RdPlot representing how the pdfs combine to produce the reconstruction.
plot_combinedPDFs(
  x,
  ages = range(x$inputs$x),
  samples = which(x$inputs$x >= min(ages) & x$inputs$x <= max(ages)),
  climate = x$parameters$climate[1],
  optima = TRUE,
  xlim = NA,
  only.present = FALSE,
  only.selected = FALSE,
  col = crestr::colour_theme(1),
  save = FALSE,
  filename = "samplePDFs.pdf",
  as.png = FALSE,
  png.res = 300,
  width = 7.48,
  height = 5
)
Arguments
- x
A
crestObjgenerated by thecrest.reconstructorcrestfunctions.- ages
An age range to subset the samples to plot. By default, all the samples will be selected.
- samples
The list of sample indexes for which the plot should be plotted. All samples will be plotted by default.
- climate
The climate variable to use to plot the variable. Default is first variable (
x$parameters$climate\[1\]).- optima
A boolean to indicate whether to plot the optimum (
TRUE) or the mean (FALSE) estimates.- xlim
The climate range to plot the pdfs on. Default is the full range used to fit the
pdfs(x$modelling$xrange).- only.present
A boolean to only add the names of the taxa recorded in the sample (default
FALSE).- only.selected
A boolean to only add the names of the selected taxa (default
FALSE).- col
A range of colour values to colour the
pdfs. Colours will be recycled to match the number of taxa.- save
A boolean to indicate if the diagram should be saved as a pdf file. Default is
FALSE.- filename
An absolute or relative path that indicates where the diagram should be saved. Also used to specify the name of the file. Default: the file is saved in the working directory under the name
'samplePDFs.pdf'.- as.png
A boolean to indicate if the output should be saved as a png. Default is
FALSEand the figure is saved as a pdf file.- png.res
The resolution of the png file (default 300 pixels per inch).
- width
The width of the output file in inches (default 7.48in ~ 19cm).
- height
The height of the output file in inches (default 5in ~ 12.7cm).
Value
No return value, this function is used to plot.
Examples
if (FALSE) { # \dontrun{
  data(crest_ex)
  data(crest_ex_pse)
  data(crest_ex_selection)
  reconstr <- crest(
    df = crest_ex, pse = crest_ex_pse, taxaType = 0,
    climate = c("bio1", "bio12"), bin_width = c(2, 20),
    shape = c("normal", "lognormal"),
    selectedTaxa = crest_ex_selection, dbname = "crest_example",
    leave_one_out = FALSE
   )
} # }
## example using pre-saved reconstruction obtained with the previous command.
data(reconstr)
plot_combinedPDFs(reconstr, ages=c(6,9), climate='bio12')