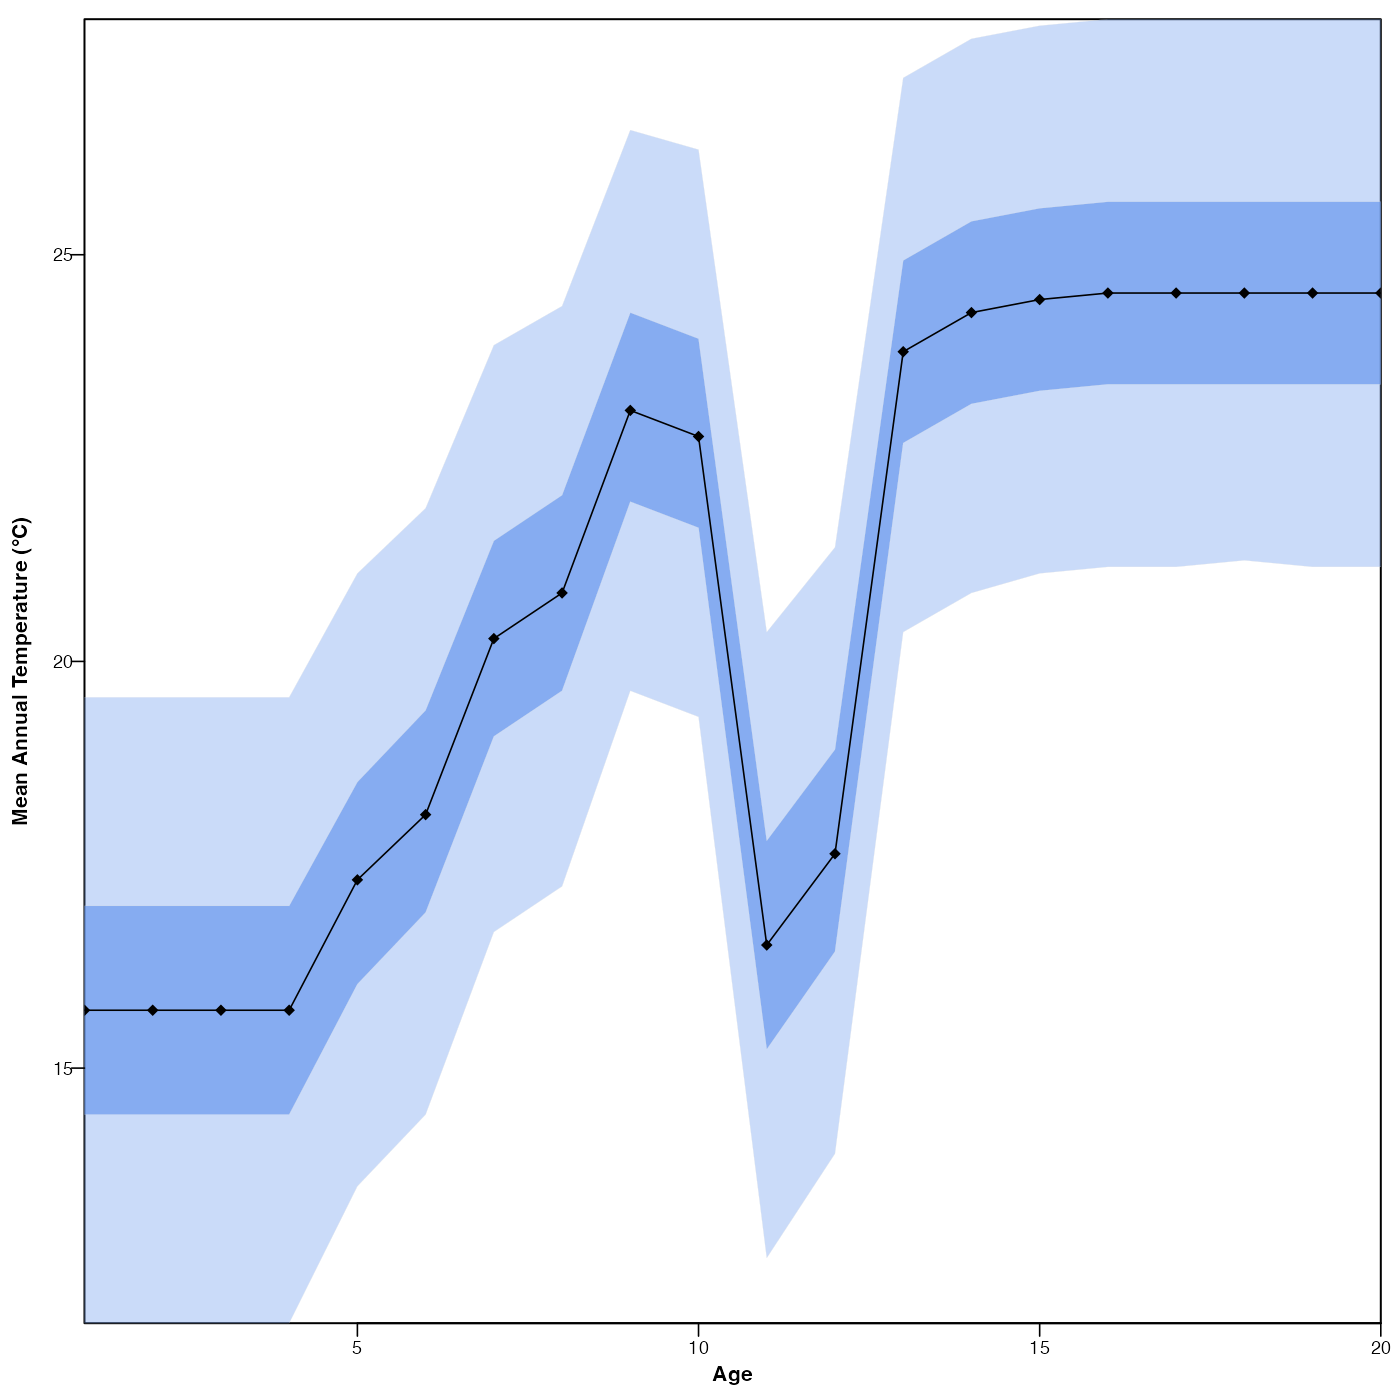
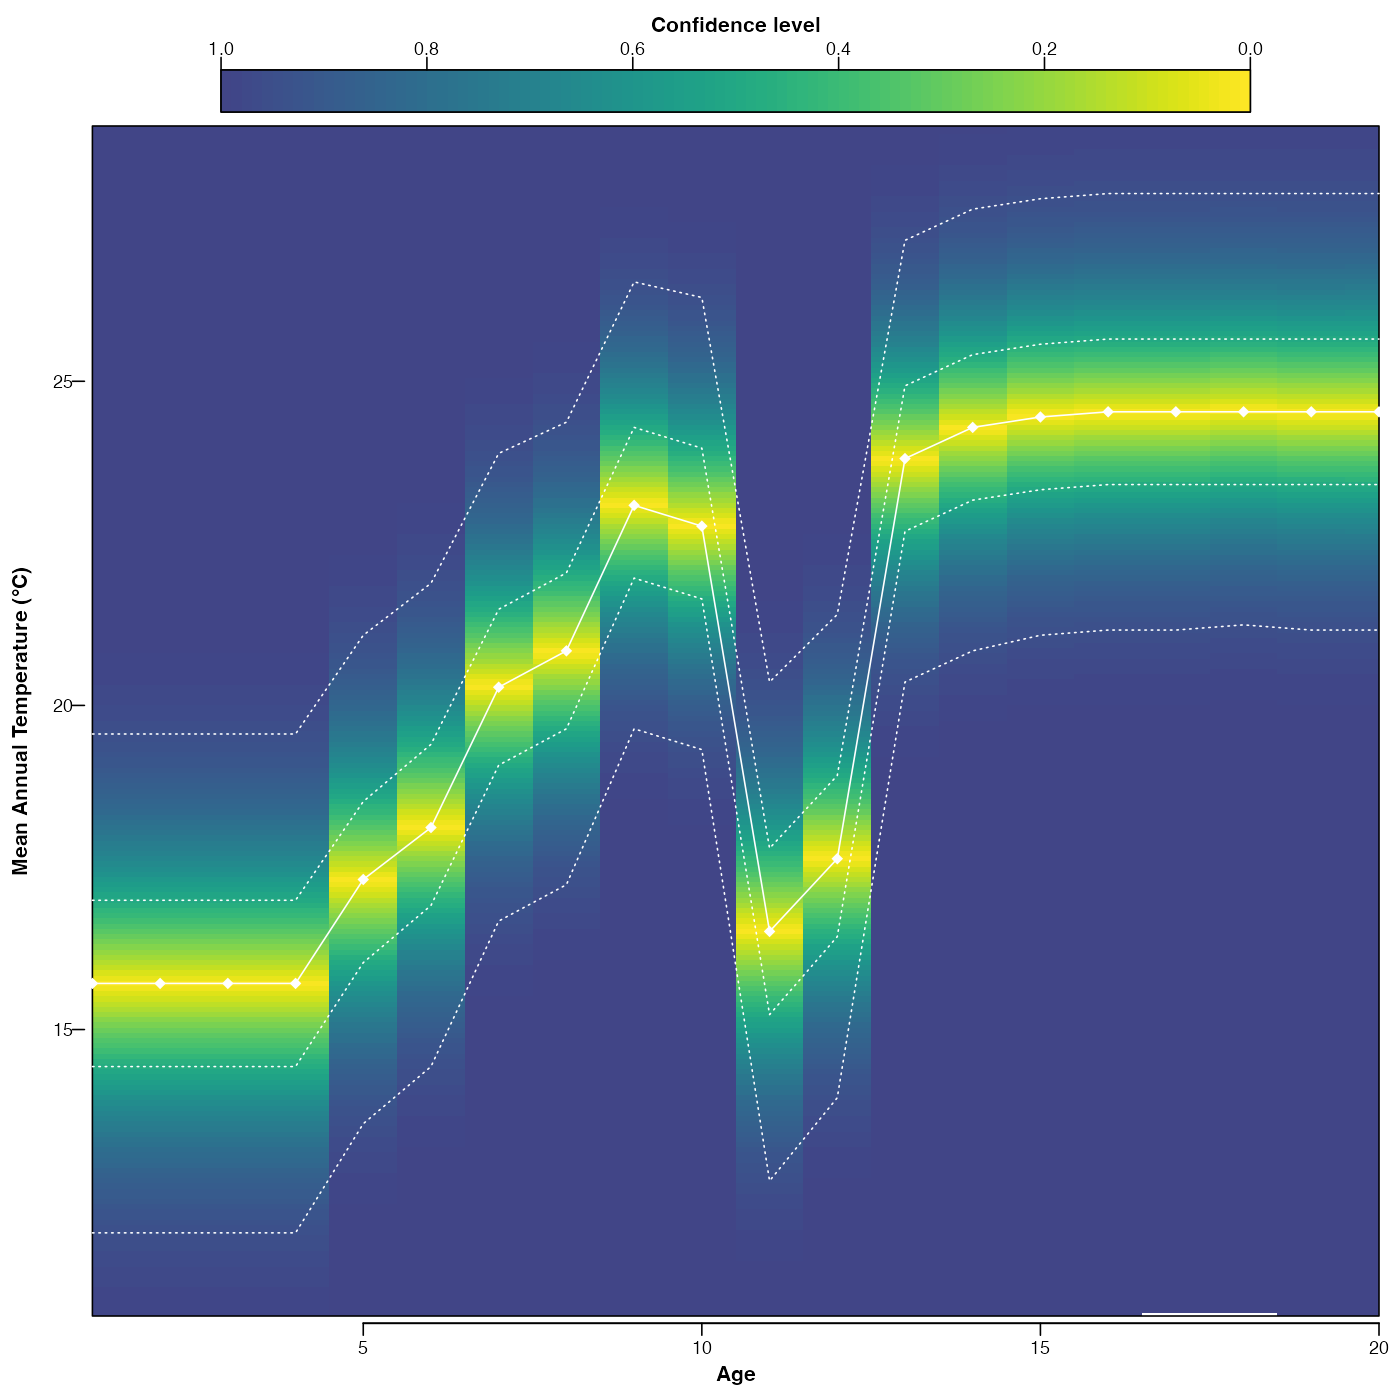
Plot the reconstructions and their uncertainties if they exist.
# S3 method for class 'crestObj'
plot(
  x,
  climate = x$parameters$climate[1],
  uncertainties = x$parameters$uncertainties,
  optima = TRUE,
  add_modern = FALSE,
  simplify = FALSE,
  as.anomaly = FALSE,
  anomaly.base = x$misc$site_info$climate[climate],
  xlim = NA,
  ylim = NA,
  pt.cex = 0.8,
  pt.lwd = 0.8,
  pt.col = ifelse(simplify, "black", "white"),
  col.hiatus = "white",
  save = FALSE,
  width = 5.51,
  height = 5.51,
  as.png = FALSE,
  png.res = 300,
  filename = "Reconstruction.pdf",
  col = viridis::viridis(125)[26:125],
  ...
)
Arguments
- x
A
crestObjproduced by thecrest,crest.reconstructorloofunctions.- climate
The climate variables to plot (default is all the reconstructed variables from x)
- uncertainties
A (vector of) threshold value(s) indicating the error bars that should be calculated (default are the values stored in x).
- optima
A boolean to indicate whether to plot the optimum (
TRUE) or the mean (FALSE) estimates.- add_modern
Adds the modern climate values to the plot.
- simplify
A boolean to indicate if the full distribution of uncertainties should be plotted (
FALSE, default) or if they should be simplified to the uncertainty range(s).- as.anomaly
A boolean to indicate if the reconstructions should be plotted as absolute values (Default,
FALSE) or anomalies '(TRUE).- anomaly.base
The anomaly value. Should be a vector with the same length as
climate. Default values are the climate values correpsonding to the location of the record (site_infoincrest.get_modern_data).- xlim
the x limits (x1, x2) of the plot. Note that
x1 > x2is allowed and leads to a ‘reversed axis’.The default value,
NULL, indicates that the range of the finite values to be plotted should be used.- ylim
the y limits of the plot.
- pt.cex
The size of the points (default 0.8).
- pt.lwd
The thickness of the lines (default 0.8).
- pt.col
The colour of the points and lines.
- col.hiatus
A colour for the hiatus(es) of the record (default white)
- save
A boolean to indicate if the diagram should be saved as a pdf file. Default is
FALSE.- width, height
The dimensions of the pdf file (default 5.51in ~14cm).
- as.png
A boolean to indicate if the output should be saved as a png. Default is
FALSEand the figure is saved as a pdf file.- png.res
The resolution of the png file (default 300 pixels per inch).
- filename
An absolute or relative path that indicates where the diagram should be saved. Also used to specify the name of the file. Default: the file is saved in the working directory under the name
'Reconstruction_climate.pdf'.- col
A colour gradient.
- ...
other graphical parameters (see
parand section ‘Details’ below).
Value
No return value, this function is used to plot.
Examples
if (FALSE) { # \dontrun{
  data(crest_ex)
  data(crest_ex_pse)
  data(crest_ex_selection)
  reconstr <- crest(
    df = crest_ex, pse = crest_ex_pse, taxaType = 0,
    climate = c("bio1", "bio12"), bin_width = c(2, 20),
    shape = c("normal", "lognormal"),
    selectedTaxa = crest_ex_selection, dbname = "crest_example"
  )
  reconstr <- loo(reconstr)
} # }
## example using pre-saved reconstruction obtained with the previous command.
data(reconstr)
plot(reconstr)

plot(reconstr, climate='bio1', simplify = TRUE, as.anomaly=TRUE)
#> Warning: No values available to calculate anomalies. Provide coordinates to crest.get_modern_data() to allow crestr to extract the local conditions, or assign values using 'anomaly.base = c(val1, val2, ...)' in the plot function.'
plot(reconstr, climate='bio1', simplify = TRUE, as.anomaly=TRUE)
#> Warning: No values available to calculate anomalies. Provide coordinates to crest.get_modern_data() to allow crestr to extract the local conditions, or assign values using 'anomaly.base = c(val1, val2, ...)' in the plot function.'